


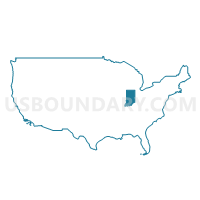
State Senate District 48, Indiana
About
Outline

Summary
| Unique Area Identifier | 200242 |
| Name | State Senate District 48 |
| State | Indiana |
| Area (square miles) | 2,102.06 |
| Land Area (square miles) | 2,059.51 |
| Water Area (square miles) | 42.55 |
| % of Land Area | 97.98 |
| % of Water Area | 2.02 |
| Latitude of the Internal Point | 38.53800320 |
| Longtitude of the Internal Point | -87.12384640 |
| Total Population | 121,761 |
| Total Housing Units | 54,437 |
| Total Households | 48,593 |
| Median Age | 40.6 |
Maps

Graphs
Select a template below for downloading or customizing gragh for State Senate District 48, Indiana


Neighbors
Neighoring State Legislative District Upper Chamber (by Name) Neighboring State Legislative District Upper Chamber on the Map
- State Senate District 39, IN
- State Senate District 44, IN
- State Senate District 47, IN
- State Senate District 49, IN
- State Senate District 50, IN
- State Senate District 54, IL
- State Senate District 55, IL
Top 10 Neighboring County (by Population) Neighboring County on the Map
- Vanderburgh County, IN (179,703)
- Warrick County, IN (59,689)
- Lawrence County, IN (46,134)
- Dubois County, IN (41,889)
- Knox County, IN (38,440)
- Gibson County, IN (33,503)
- Greene County, IN (33,165)
- Daviess County, IN (31,648)
- Posey County, IN (25,910)
- Sullivan County, IN (21,475)
Top 10 Neighboring County Subdivision (by Population) Neighboring County Subdivision on the Map
- Vincennes township, Knox County, IN (23,707)
- Bainbridge township, Dubois County, IN (16,020)
- Washington township, Daviess County, IN (15,534)
- Patoka township, Gibson County, IN (11,864)
- Marion township, Lawrence County, IN (9,449)
- Scott township, Vanderburgh County, IN (8,528)
- Stockton township, Greene County, IN (8,447)
- Mount Carmel precinct, Wabash County, IL (8,389)
- Patoka township, Dubois County, IN (7,527)
- Paoli township, Orange County, IN (6,031)
Top 10 Neighboring Place (by Population) Neighboring Place on the Map
- Jasper city, IN (15,038)
- Washington city, IN (11,509)
- Princeton city, IN (8,644)
- Mount Carmel city, IL (7,284)
- Linton city, IN (5,413)
- Bicknell city, IN (2,915)
- Fort Branch town, IN (2,771)
- Loogootee city, IN (2,751)
- Oakland City city, IN (2,429)
- Petersburg city, IN (2,383)
Top 10 Neighboring Unified School District (by Population) Neighboring Unified School District on the Map
- Evansville-Vanderburgh School Corporation, IN (179,703)
- Warrick County School Corporation, IN (59,689)
- North Lawrence Community Schools, IN (34,125)
- Vincennes Community School Corporation, IN (23,393)
- Greater Jasper Consolidated Schools, IN (19,515)
- Washington Community School Corporation, IN (17,325)
- North Gibson School Corporation, IN (14,338)
- Pike County School Corporation, IN (12,845)
- South Gibson School Corporation, IN (12,317)
- Mitchell Community Schools, IN (12,009)
Top 10 Neighboring State Legislative District Lower Chamber (by Population) Neighboring State Legislative District Lower Chamber on the Map
- State House District 109, IL (103,405)
- State House District 108, IL (102,103)
- State House District 78, IN (77,639)
- State House District 65, IN (64,454)
- State House District 63, IN (64,153)
- State House District 73, IN (62,643)
- State House District 74, IN (61,219)
- State House District 75, IN (61,152)
- State House District 64, IN (60,833)
- State House District 62, IN (60,681)
Top 10 Neighboring 111th Congressional District (by Population) Neighboring 111th Congressional District on the Map
- Congressional District 4, IN (789,835)
- Congressional District 9, IN (729,076)
- Congressional District 8, IN (694,398)
- Congressional District 15, IL (681,580)
Top 10 Neighboring Census Tract (by Population) Neighboring Census Tract on the Map
- Census Tract 9545, Daviess County, IN (9,228)
- Census Tract 107, Vanderburgh County, IN (8,528)
- Census Tract 502, Gibson County, IN (8,291)
- Census Tract 9506, Lawrence County, IN (7,284)
- Census Tract 9537, Dubois County, IN (7,258)
- Census Tract 9533, Dubois County, IN (7,164)
- Census Tract 9507, Lawrence County, IN (6,877)
- Census Tract 9532, Dubois County, IN (6,403)
- Census Tract 8808, Lawrence County, IL (5,769)
- Census Tract 401, Posey County, IN (5,739)
Top 10 Neighboring 5-Digit ZIP Code Tabulation Area (by Population) Neighboring 5-Digit ZIP Code Tabulation Area on the Map
- 47591, IN (26,770)
- 47546, IN (21,009)
- 47501, IN (17,535)
- 47725, IN (15,851)
- 47670, IN (12,352)
- 62863, IL (10,183)
- 47446, IN (9,990)
- 47542, IN (9,622)
- 47424, IN (9,525)
- 47441, IN (9,269)
Data
Demographic, Population, Households, and Housing Units
** Data sources from census 2010 **
Show Data on Map
Download Full List as CSV
Download Quick Sheet as CSV
| Subject | This Area | Indiana | National |
|---|---|---|---|
| POPULATION | |||
| Total Population Map | 121,761 | 6,483,802 | 308,745,538 |
| POPULATION, HISPANIC OR LATINO ORIGIN | |||
| Not Hispanic or Latino Map | 118,392 | 6,094,095 | 258,267,944 |
| Hispanic or Latino Map | 3,369 | 389,707 | 50,477,594 |
| POPULATION, RACE | |||
| White alone Map | 116,702 | 5,467,906 | 223,553,265 |
| Black or African American alone Map | 1,022 | 591,397 | 38,929,319 |
| American Indian and Alaska Native alone Map | 275 | 18,462 | 2,932,248 |
| Asian alone Map | 551 | 102,474 | 14,674,252 |
| Native Hawaiian and Other Pacific Islander alone Map | 31 | 2,348 | 540,013 |
| Some Other Race alone Map | 1,729 | 173,314 | 19,107,368 |
| Two or More Races Map | 1,451 | 127,901 | 9,009,073 |
| POPULATION, SEX | |||
| Male Map | 60,537 | 3,189,737 | 151,781,326 |
| Female Map | 61,224 | 3,294,065 | 156,964,212 |
| POPULATION, AGE (18 YEARS) | |||
| 18 years and over Map | 92,317 | 4,875,504 | 234,564,071 |
| Under 18 years | 29,444 | 1,608,298 | 74,181,467 |
| POPULATION, AGE | |||
| Under 5 years | 7,910 | 434,075 | 20,201,362 |
| 5 to 9 years | 8,110 | 444,821 | 20,348,657 |
| 10 to 14 years | 8,279 | 452,171 | 20,677,194 |
| 15 to 17 years | 5,145 | 277,231 | 12,954,254 |
| 18 and 19 years | 2,826 | 198,284 | 9,086,089 |
| 20 years | 1,282 | 98,994 | 4,519,129 |
| 21 years | 1,243 | 94,313 | 4,354,294 |
| 22 to 24 years | 3,966 | 258,719 | 12,712,576 |
| 25 to 29 years | 6,980 | 419,530 | 21,101,849 |
| 30 to 34 years | 6,832 | 407,815 | 19,962,099 |
| 35 to 39 years | 7,386 | 417,011 | 20,179,642 |
| 40 to 44 years | 7,807 | 423,819 | 20,890,964 |
| 45 to 49 years | 9,401 | 473,946 | 22,708,591 |
| 50 to 54 years | 9,440 | 472,822 | 22,298,125 |
| 55 to 59 years | 8,523 | 418,515 | 19,664,805 |
| 60 and 61 years | 3,173 | 150,022 | 7,113,727 |
| 62 to 64 years | 4,291 | 200,606 | 9,704,197 |
| 65 and 66 years | 2,341 | 109,710 | 5,319,902 |
| 67 to 69 years | 3,382 | 149,347 | 7,115,361 |
| 70 to 74 years | 4,588 | 193,278 | 9,278,166 |
| 75 to 79 years | 3,504 | 151,843 | 7,317,795 |
| 80 to 84 years | 2,773 | 121,658 | 5,743,327 |
| 85 years and over | 2,579 | 115,272 | 5,493,433 |
| MEDIAN AGE BY SEX | |||
| Both sexes Map | 40.60 | 37.00 | 37.20 |
| Male Map | 39.40 | 35.70 | 35.80 |
| Female Map | 42.00 | 38.20 | 38.50 |
| HOUSEHOLDS | |||
| Total Households Map | 48,593 | 2,502,154 | 116,716,292 |
| HOUSEHOLDS, HOUSEHOLD TYPE | |||
| Family households: Map | 33,353 | 1,674,126 | 77,538,296 |
| Husband-wife family Map | 26,438 | 1,241,267 | 56,510,377 |
| Other family: Map | 6,915 | 432,859 | 21,027,919 |
| Male householder, no wife present Map | 2,233 | 122,677 | 5,777,570 |
| Female householder, no husband present Map | 4,682 | 310,182 | 15,250,349 |
| Nonfamily households: Map | 15,240 | 828,028 | 39,177,996 |
| Householder living alone Map | 13,094 | 671,920 | 31,204,909 |
| Householder not living alone Map | 2,146 | 156,108 | 7,973,087 |
| HOUSEHOLDS, HISPANIC OR LATINO ORIGIN OF HOUSEHOLDER | |||
| Not Hispanic or Latino householder: Map | 47,838 | 2,403,018 | 103,254,926 |
| Hispanic or Latino householder: Map | 755 | 99,136 | 13,461,366 |
| HOUSEHOLDS, RACE OF HOUSEHOLDER | |||
| Householder who is White alone | 47,228 | 2,171,176 | 89,754,352 |
| Householder who is Black or African American alone | 365 | 220,246 | 14,129,983 |
| Householder who is American Indian and Alaska Native alone | 108 | 6,912 | 939,707 |
| Householder who is Asian alone | 148 | 32,567 | 4,632,164 |
| Householder who is Native Hawaiian and Other Pacific Islander alone | 9 | 688 | 143,932 |
| Householder who is Some Other Race alone | 417 | 43,842 | 4,916,427 |
| Householder who is Two or More Races | 318 | 26,723 | 2,199,727 |
| HOUSEHOLDS, HOUSEHOLD TYPE BY HOUSEHOLD SIZE | |||
| Family households: Map | 33,353 | 1,674,126 | 77,538,296 |
| 2-person household Map | 15,661 | 729,444 | 31,882,616 |
| 3-person household Map | 7,259 | 378,922 | 17,765,829 |
| 4-person household Map | 6,085 | 318,738 | 15,214,075 |
| 5-person household Map | 2,855 | 153,042 | 7,411,997 |
| 6-person household Map | 975 | 58,414 | 3,026,278 |
| 7-or-more-person household Map | 518 | 35,566 | 2,237,501 |
| Nonfamily households: Map | 15,240 | 828,028 | 39,177,996 |
| 1-person household Map | 13,094 | 671,920 | 31,204,909 |
| 2-person household Map | 1,793 | 124,749 | 6,360,012 |
| 3-person household Map | 202 | 19,544 | 992,156 |
| 4-person household Map | 102 | 8,255 | 411,171 |
| 5-person household Map | 31 | 2,393 | 126,634 |
| 6-person household Map | 12 | 737 | 48,421 |
| 7-or-more-person household Map | 6 | 430 | 34,693 |
| HOUSING UNITS | |||
| Total Housing Units Map | 54,437 | 2,795,541 | 131,704,730 |
| HOUSING UNITS, OCCUPANCY STATUS | |||
| Occupied Map | 48,593 | 2,502,154 | 116,716,292 |
| Vacant Map | 5,844 | 293,387 | 14,988,438 |
| HOUSING UNITS, OCCUPIED, TENURE | |||
| Owned with a mortgage or a loan Map | 22,398 | 1,259,825 | 52,979,430 |
| Owned free and clear Map | 14,486 | 488,150 | 23,006,644 |
| Renter occupied Map | 11,709 | 754,179 | 40,730,218 |
| HOUSING UNITS, VACANT, VACANCY STATUS | |||
| For rent Map | 1,197 | 93,029 | 4,137,567 |
| Rented, not occupied Map | 98 | 3,859 | 206,825 |
| For sale only Map | 816 | 46,410 | 1,896,796 |
| Sold, not occupied Map | 314 | 10,862 | 421,032 |
| For seasonal, recreational, or occasional use Map | 1,282 | 45,571 | 4,649,298 |
| For migrant workers Map | 12 | 200 | 24,161 |
| Other vacant Map | 2,125 | 93,456 | 3,652,759 |
| HOUSING UNITS, OCCUPIED, AVERAGE HOUSEHOLD SIZE BY TENURE | |||
| Total: Map | 2.46 | 2.52 | 2.58 |
| Owner occupied Map | 2.52 | 2.60 | 2.65 |
| Renter occupied Map | 2.26 | 2.33 | 2.44 |
| HOUSING UNITS, OCCUPIED, TENURE BY RACE OF HOUSEHOLDER | |||
| Owner occupied: Map | 36,884 | 1,747,975 | 75,986,074 |
| Householder who is White alone Map | 36,180 | 1,604,197 | 63,446,275 |
| Householder who is Black or African American alone Map | 196 | 89,346 | 6,261,464 |
| Householder who is American Indian and Alaska Native alone Map | 69 | 3,927 | 509,588 |
| Householder who is Asian alone Map | 70 | 16,499 | 2,688,861 |
| Householder who is Native Hawaiian and Other Pacific Islander alone Map | 4 | 363 | 61,911 |
| Householder who is Some Other Race alone Map | 179 | 20,395 | 1,975,817 |
| Householder who is Two or More Races Map | 186 | 13,248 | 1,042,158 |
| Renter occupied: Map | 11,709 | 754,179 | 40,730,218 |
| Householder who is White alone Map | 11,048 | 566,979 | 26,308,077 |
| Householder who is Black or African American alone Map | 169 | 130,900 | 7,868,519 |
| Householder who is American Indian and Alaska Native alone Map | 39 | 2,985 | 430,119 |
| Householder who is Asian alone Map | 78 | 16,068 | 1,943,303 |
| Householder who is Native Hawaiian and Other Pacific Islander alone Map | 5 | 325 | 82,021 |
| Householder who is Some Other Race alone Map | 238 | 23,447 | 2,940,610 |
| Householder who is Two or More Races Map | 132 | 13,475 | 1,157,569 |
| HOUSING UNITS, OCCUPIED, TENURE BY HISPANIC OR LATINO ORIGIN OF HOUSEHOLDER | |||
| Owner occupied: Map | 36,884 | 1,747,975 | 75,986,074 |
| Not Hispanic or Latino householder Map | 36,544 | 1,696,271 | 69,617,625 |
| Hispanic or Latino householder Map | 340 | 51,704 | 6,368,449 |
| Renter occupied: Map | 11,709 | 754,179 | 40,730,218 |
| Not Hispanic or Latino householder Map | 11,294 | 706,747 | 33,637,301 |
| Hispanic or Latino householder Map | 415 | 47,432 | 7,092,917 |
| HOUSING UNITS, OCCUPIED, TENURE BY HOUSEHOLD SIZE | |||
| Owner occupied: Map | 36,884 | 1,747,975 | 75,986,074 |
| 1-person household Map | 8,227 | 379,164 | 16,453,569 |
| 2-person household Map | 14,548 | 659,731 | 27,618,605 |
| 3-person household Map | 5,795 | 283,901 | 12,517,563 |
| 4-person household Map | 4,923 | 245,272 | 10,998,793 |
| 5-person household Map | 2,266 | 113,305 | 5,057,765 |
| 6-person household Map | 742 | 41,703 | 1,965,796 |
| 7-or-more-person household Map | 383 | 24,899 | 1,373,983 |
| Renter occupied: Map | 11,709 | 754,179 | 40,730,218 |
| 1-person household Map | 4,867 | 292,756 | 14,751,340 |
| 2-person household Map | 2,906 | 194,462 | 10,624,023 |
| 3-person household Map | 1,666 | 114,565 | 6,240,422 |
| 4-person household Map | 1,264 | 81,721 | 4,626,453 |
| 5-person household Map | 620 | 42,130 | 2,480,866 |
| 6-person household Map | 245 | 17,448 | 1,108,903 |
| 7-or-more-person household Map | 141 | 11,097 | 898,211 |
Loading...